Lida Joly explains how data-driven traffic analytics will help us reach zero emissions and zero fatalities

According to the World Health Organization (WHO), approximately 1.3 million people die every year because of road accidents – that’s two fatalities every minute. That doesn’t include non-fatal traffic incidents, even though these have a significant impact not only on the individuals involved and their family but also the economy. The WHO estimates road traffic crashes cost most countries around 3% of their gross domestic products.
Meanwhile, according to the International Energy Agency, road transport was responsible for approximately 25% of all CO2 emissions in 2021. Traffic emissions also harm the public health – a report from the European Environment Agency indicates air pollution is the single largest environmental health risk for the European population, with exposure triggering diseases such as lung cancer and asthma and reducing life expectancy.
With its Smart and Sustainable Mobility Strategy, the European Commission has set the ambitious goal of reducing emissions and serious accidents by 50% by 2030. Furthermore, the commission and the United States’ Department of Transportation plan to realise Vision Zero, the target of which is to achieve zero road fatalities and emissions. But how to reach these ambitious goals?
A promising trend is to leverage big data and data-driven analytics to help governments and local authorities accelerate towards Vision Zero. Using such technologies not only offers new ways to measure and monitor traffic for better safety and efficiency, it also enables us to combine data sets and contextualise analysis.
We are living in an increasingly connected world, with the Internet of Things (IoT) integrating into every industry and innovative applications generating huge amounts of data. Connected vehicles generate data that informs us where, when and how fast a car is driving. Satellites are capturing weather, pollution and other atmospheric data. Everything is being measured enabling us to understand what mobility is, how traffic is evolving, and the impact it has on the world.
Measuring performance
To achieve its goals, the European Commission has outlined different key performance indicators, with ‘infrastructure safety’ (dangerous situations) and ‘safe road use’ (speeding) among the most important ones.
Previously, road authorities and governments would record and analyse locations of frequent crashes and safety incidents before being able to take measures. Now data-driven traffic analytics enables road authorities to transition from a reactive to a proactive approach. Connected vehicle data can be fed into artificial intelligence models together with other types of data, such as weather and historical unsafe driving data, to identify where accidents are most likely to happen even before one occurs. Such simulations and analysis can also be performed also when redesigning or starting a road construction programme. Being pro-active is a must when aiming for zero road incidents.
Similarly, data analytics is used to drive the transition to greenification and electrification of vehicle fleets.
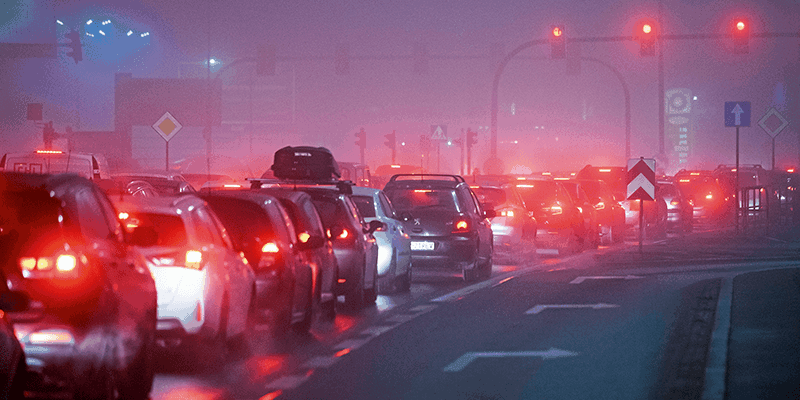
Inefficient traffic situations, such as congestion, contribute to an increase in emissions and air pollution. Data-driven traffic analytics is used to measure such inefficient patterns and determine where traffic is coming from and going to, how it’s flowing through dense urban areas, and which measurements can be installed for a smoother process – for example, to optimise traffic light performance.
On the other hand, the electrification of vehicles offers a promising reduction in traffic emissions but requires the necessary support. Trucking companies are now analysing movement patterns of their trucking lines and optimising replacement of traditional trucks based on the driving journey, waiting times and the existing infrastructure for charging electric vehicles (EV). EV-charging operators are now looking to optimise the location for the installation of truck charging stations, knowing that a single installation easily costs €10 million of investment.
Connected but fragmented
The traffic and big data industry is in an interesting phase right now. D ue to IoT technology, many mobility companies and traffic authorities are generating mountains of data. However, most don’t know what to do with it or fail to maximise value extraction from the data.
The seeming complexity of traffic data analytics often stops companies from starting to learn from their traffic data. This highlights the need for simple solutions that not only facilitate the analytical process, but also enable companies to leverage multiple data sources at once.
We live in a connected world, but the industry is still fragmented. New innovations and data sources are emerging on the market, such as multi-modality and the availability of public transport and electric bike data.
However, most tools are closed boxes that only handle one type of data set. Standardisation and open boxes are becoming increasingly important as we move forward, as well as collaborations between market leaders and other participants bringing new innovations to the market.
Collaborations are already taking place: INRIX and General Motors have jointly released a new road safety platform; Wejo and NIRA Dynamics have released a new road health and safety platform; and xyzt.ai and Bridgestone are providing municipalities with a fast and easy solution to monitor road safety and efficiency.
Data-driven analytics is helping the world become a safer and greener place. To reach the ambitious goals of 2030 and 2050, we need more accessibility to big data, the necessary tools to visualise and analyse the big picture, and more and stronger collaborations between old and new industry players.
Lida Joly is the CEO of xyzt.ai (www.xyzt.ai)


