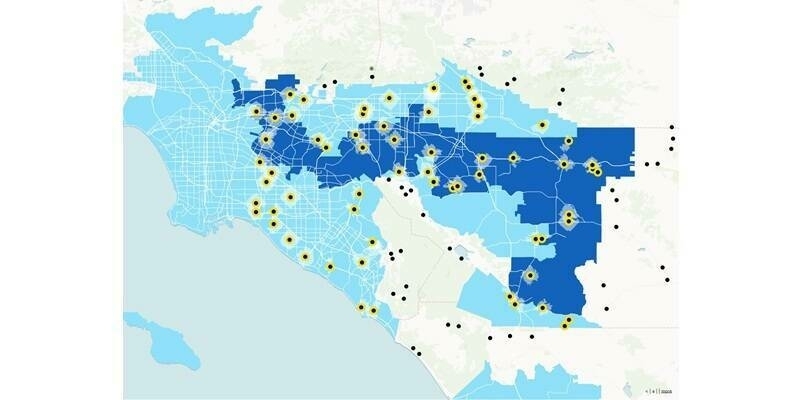
As the storm develops please feel free to use Esri’s Hurricane Matthew Story Map. Included is social media storm information plotted on a map, number of businesses and populations impacted by the storm, areas where flooding is most likely to occur, and more.
http://www.arcgis.com/apps/MapSeries/index.html?appid=db6238df958148108cceb3b05619a7f6
If you would like to share with your followers, viewers, and audience, you can use this link: http://arcg.is/2ca1BQo
If you would like to embed within an article, you can use this code:
<iframe width="100%" height="800px" src="http://www.arcgis.com/apps/MapSeries/index.html?appid=db6238df958148108cceb3b05619a7f6" frameborder="0" scrolling="no"></iframe>
Subscribe to our newsletter
Stay updated on the latest technology, innovation product arrivals and exciting offers to your inbox.
Newsletter

