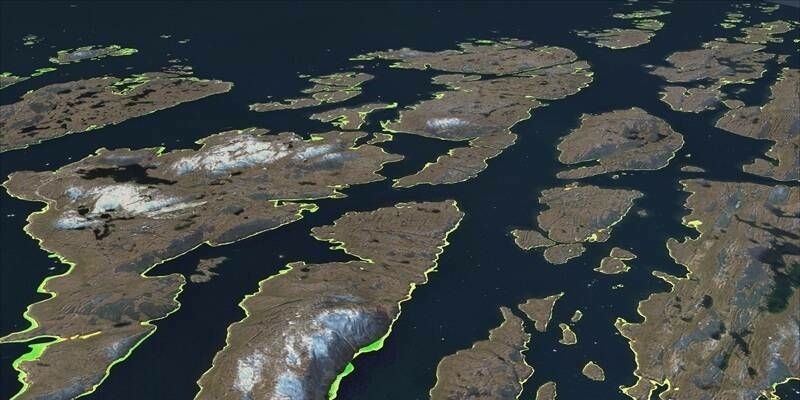
The National Geographic Database of Great Britain, maintained by Ordnance Survey (OS), is one of the largest of its kind in the world and during the past decade it has grown to contain more than 500 million unique geographic features. Since January 2010 OS has made 360 million updates to the database. Arguably, no one knows Great Britain better than Ordnance Survey.
Each day OS adds to the National Geographic Database (or removes if no longer there) the fixed location of new physical objects across Great Britain. OS makes more than 20,000 changes to the database each day, with each update containing many data points and attributions.
OS records every inch of Great Britain, even its most remote regions, to the same high standards and accuracy which has come to be expected by thousands of customers who rely on detailed maps and data. This activity produces a single source of truth that government, business and people can trust and use.
Great Britain in numbers:
- At the end of the decade Britain had 44.8 million buildings in total, up from 40.6 million in 2010, an increase of 10.3%. In 2010 buildings covered 1.24% of Great Britain, they now cover 1.38% of the nation.
- The natural environment cover in Great Britain has fallen 2.7% from 59,232 sq km to 57,629 sq km, but it still covers 25% of Great Britain.
- 45% of Great Britain is agricultural landcover and 14% is woodland, with woodland increasing by 9.25% in the past decade going from 29,276 sq km in 2010 to 31,985 sq km in 2020.
- If we add up the total sq km for all buildings, gardens, transport infrastructure and other manmade items in the built environment we get 19,489 sq km of built up area, which means it covers 8.3% of Great Britain.
- All over the country the km sq coverage of gardens went up by an average of 5%, with London being the exception to this with its garden cover falling 3%.
The data OS produces and maintains is vital to government activities and initiatives at local and national levels and helps drive efficiencies and underpin many public services. It is used in virtually all business sectors by start-ups and large multinationals alike.
Most of us encounter OS data daily without realising through our Sat-Navs, Internet mapping and mapping on our smart phones and devices. Recent research carried out by Ordnance Survey discovered that on average we come into contact with OS data 42 times a day.
Subscribe to our newsletter
Stay updated on the latest technology, innovation product arrivals and exciting offers to your inbox.
Newsletter

