Share
An extreme weather toolbox based on the Open Source rasdaman data cube server uses real-time analysis to reliably identify weather risks for agriculture.

A research project undertaken at University of Augsburg in Germany has made ground-breaking advances in digital agricultural meteorology. The goal of the project - funded by the Federal Ministry of Food and Agriculture (BMEL) and initialised/coordinated by the Julius Kühn Institute (JKI), Federal Research Centre for Cultivated Plants - was to develop a powerful geodata infrastructure for real-time analysis of extreme weather events and their effects on agriculture.
The resulting DynAWI Extreme Weather Toolbox enables flexible, scalable, and highly precise analysis of multidimensional weather and soil data for the first time.
Technical innovations
The DynAWI toolbox is based on a modular architecture with three main components:
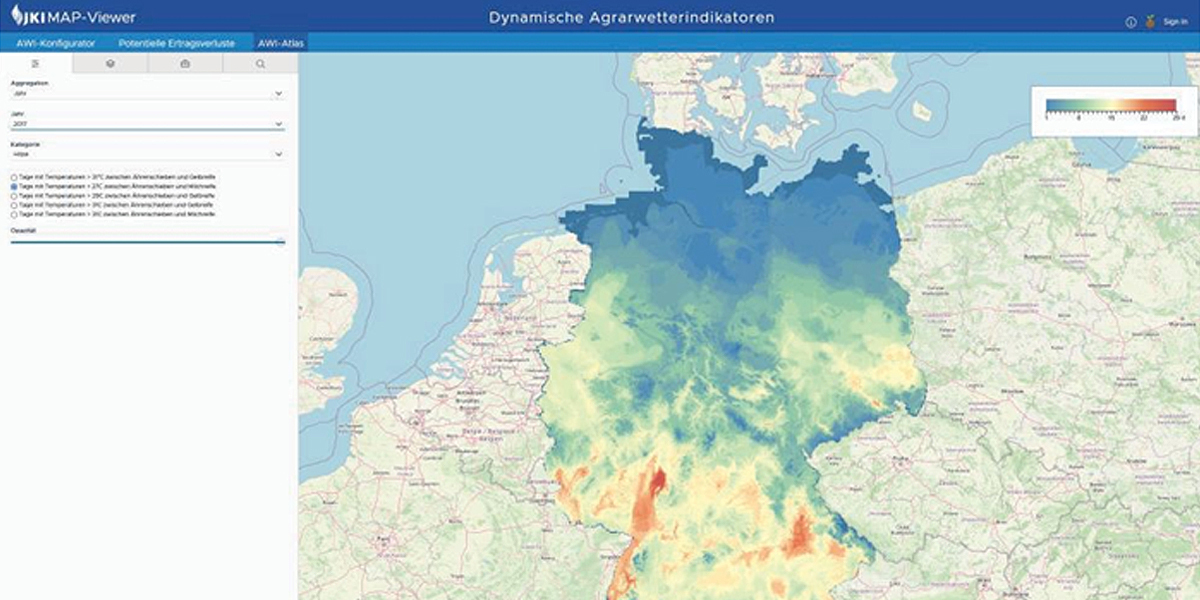
• AWI-Atlas: A data-driven platform for retrospective analysis of historical agro-weather indicators based on a homogeneous time series from 1995 onwards.
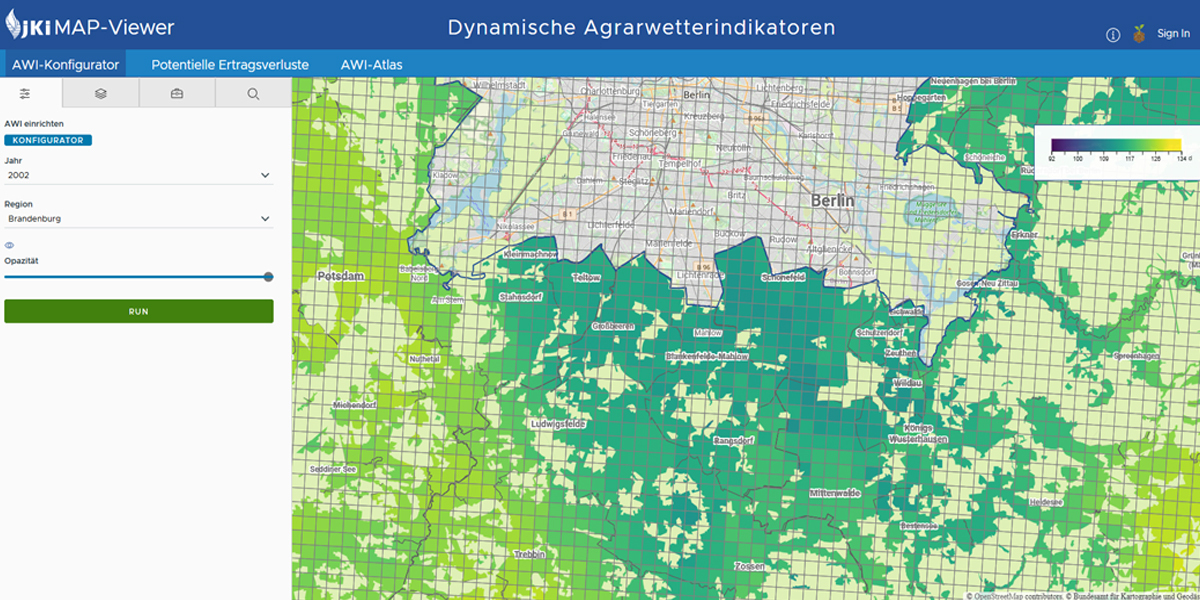
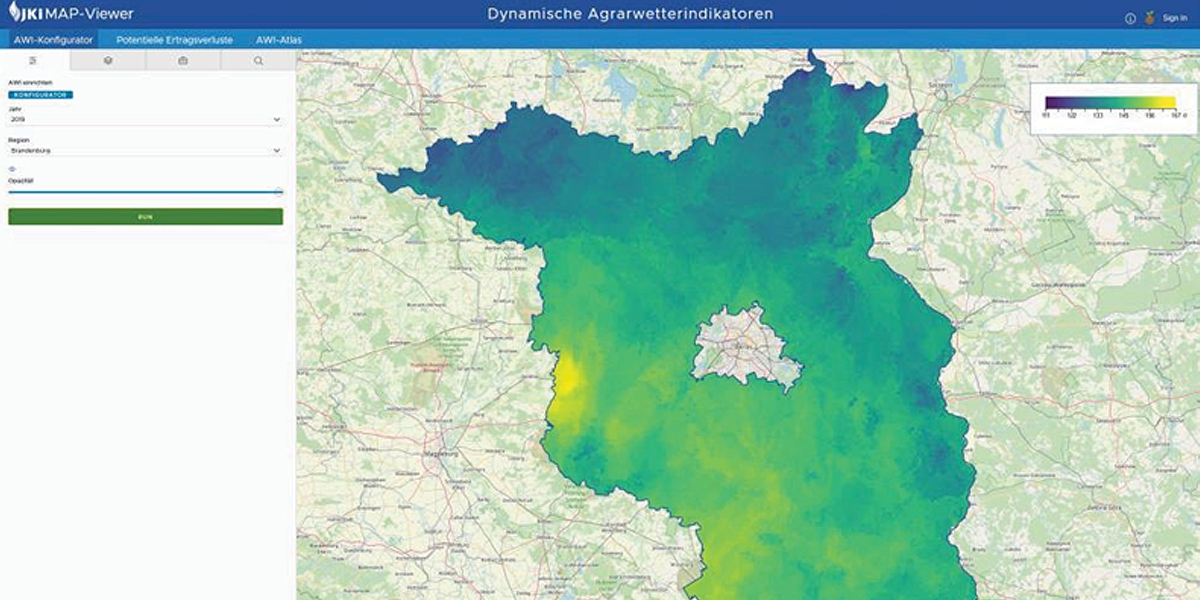
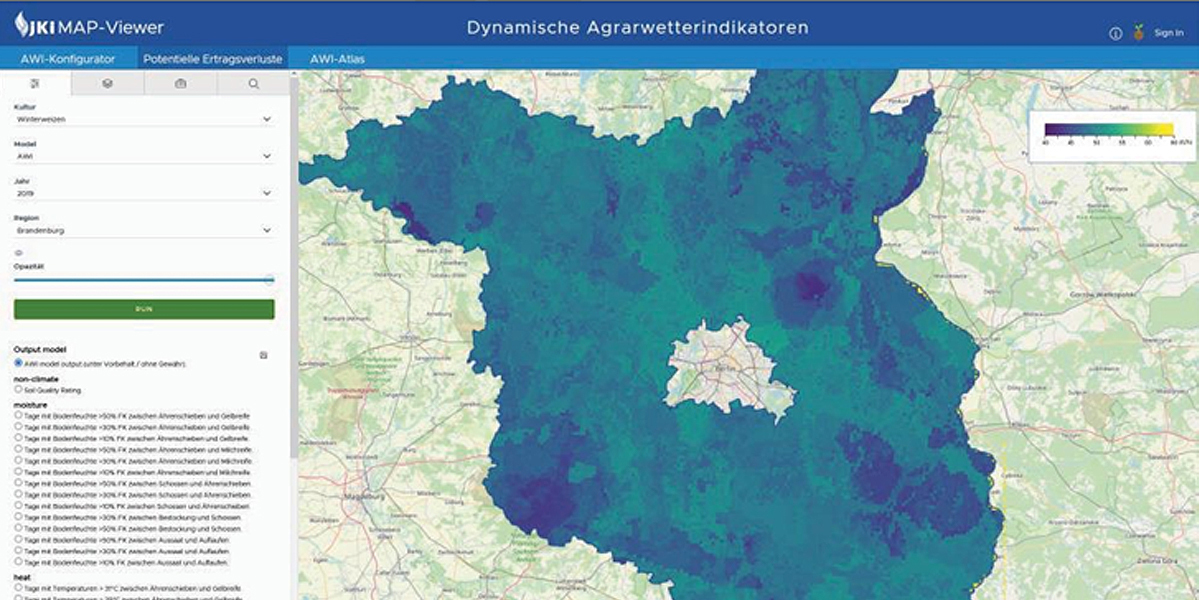
• AWI Configurator: an interactive analysis tool that enables the generation of dynamic agricultural weather indicators using the OGC standard Web Coverage Processing Service (WCPS).
• AWI Yield Model: a machine learning-based forecasting model to estimate potential crop losses under extreme weather conditions.
The technological basis of these components represents a significant innovation: The system uses the Open Source rasdaman (raster data manager) data cube tool, a scalable geodata infrastructure that has been optimised for the efficient processing of spatio-temporal geodata.
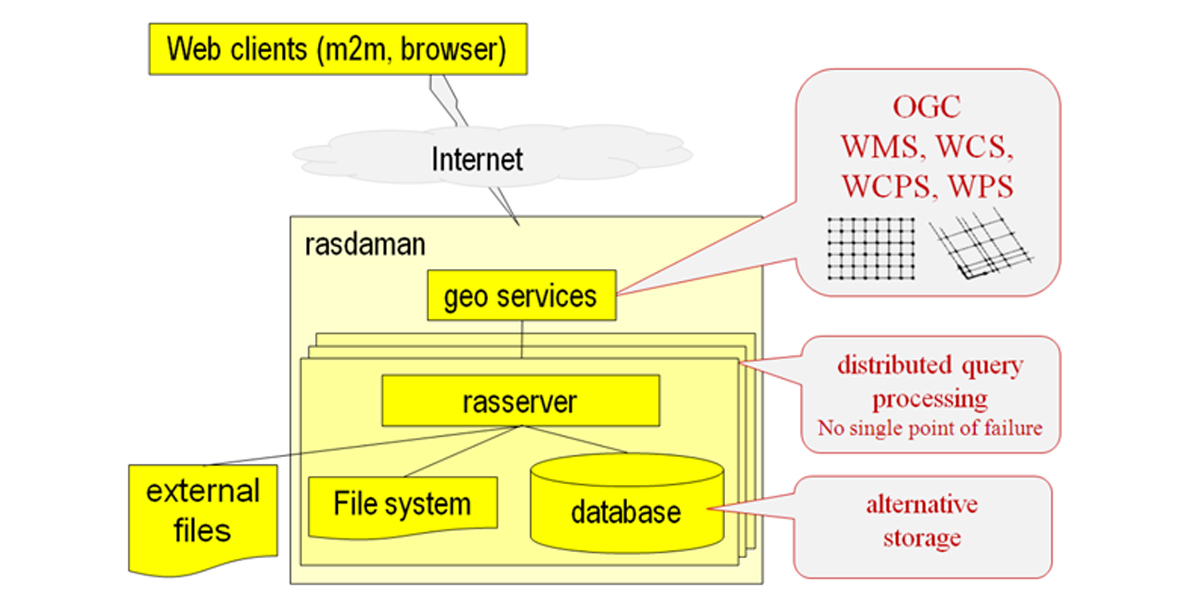
The use of the WCPS standard enables flexible, high-performance querying and analysis of large-area, high-resolution raster data directly within the database, from Python or a variety of other 3rd party clients. This makes it possible to perform complex analyses with minimal computing time and without redundant data transfers.
Modified or new queries can be implemented quickly and easily. Data management is automated, with no need for human intervention.
Progress through high-performance data processing
The implementation of rasdaman in the DynAWI project allows a significant increase in efficiency through fast, memory-optimised queries. The result is an up to tenfold increase in performance when analysing large amounts of geodata.
In addition, algorithms for real-time processing and visualisation have been implemented. For example, the AWI configurator enables the dynamic generation of climate risk indicators based on freely selectable parameters. Users can analyse agro-meteorological data in high spatial and temporal resolution, define automated threshold values and assess their effects in real time.
Areas of application and further development
The DynAWI technology provides a robust basis for further research and industrial applications. Possible extensions include:
• Integration of additional sensor data to refine real-time forecasts,
• optimisation of Machine Learning models through the use of neural networks, and
• expansion of the geodata infrastructure for international applications.
The DynAWI toolbox has created a new technological platform that lays the foundation for future innovations in digital agricultural meteorology. The project demonstrates the potential of modern database technologies for highly scalable and efficient weather and climate analyses.
The AWI Atlas offers users the opportunity to view the development of agricultural weather indicators in Germany for the years 1995 to 2020 retrospectively using a classic map display via a MapViewer application. Users can choose from 34 standardised AWIs, which are sorted into the six categories of heat, drought, soil moisture, precipitation, night frost and wind speed. In addition to the annual presentation, the 26-year mean and the associated standard deviation can also be displayed.
The AWI Configurator allows the free configuration of user-specific dynamic agri-meteorological indicators in real time by combining relevant agri-meteorological parameters such as soil moisture, daily precipitation, soil temperature with phenological stages and setting user-specific thresholds. In addition to the predefined spatial regions (federal states), it is also possible to query your own geometries, such as field blocks or individual plots. The geometry is entered in the form of a geojson..
The AWI model component enables a quantitative evaluation of potential yield losses due to extreme weather events. The current implementation focuses on winter wheat (Triticum aestivum L.) and covers a thirty-year analysis period from 1995 to 2020. The underlying model was parameterised using expert knowledge and enables retrospective analyses of historical data. The calculation of the model results is carried out in real time and allows the user to use an instrument to independently estimate weather-related yield risks in winter wheat cultivation.
Project partners of the DynAWI project are: Julius-Kühn-Institut, University of Augsburg, rasdaman GmbH, Soilution and Vereinigte Hagelversicherung VVaG (VH)
Source: *1 : https://www.openagrar.de/recei...
Story Source: Heike Hoenig, Director Communication, rasdaman GmbH, Bremen, Germany
Subscribe to our newsletter
Stay updated on the latest technology, innovation product arrivals and exciting offers to your inbox.
Newsletter